
How to Set Up Alibaba Cloud Kubernetes Cluster Monitoring with Helm and Prometheus Operator
Setting up monitoring for your Kubernetes cluster allows you to track your resource usage and analyze and debug application errors.
Along with tracing and logging, monitoring and alerting are essential components of a Kubernetes observability stack. Setting up monitoring for your Kubernetes cluster allows you to track your resource usage and analyze and debug application errors.
A monitoring system usually consists of a time-series database that houses metric data and a visualization layer. In addition, an alerting layer creates and manages alerts, handing them off to integrations and external services as necessary. Finally, one or more components generate or expose the metric data that will be stored, visualized, and processed for alerts by this monitoring stack.
One popular monitoring solution is the open-source Prometheus, Grafana, and Alertmanager stack:
- Prometheus is a time series database and monitoring tool that works by polling metrics endpoints and scraping and processing the data exposed by these endpoints. It allows you to query this data using PromQL, a time series data query language.
- Grafana is a data visualization and analytics tool that allows you to build dashboards and graphs for your metrics data.
- Alertmanager, usually deployed alongside Prometheus, forms the alerting layer of the stack, handling alerts generated by Prometheus and deduplicating, grouping, and routing them to integrations like email or PagerDuty.
In addition, tools like kube-state-metrics and node_exporter expose cluster-level Kubernetes object metrics as well as machine-level metrics like CPU and memory usage.
Implementing this monitoring stack on a Kubernetes cluster can be complicated, but luckily some of this complexity can be managed with the Helm package manager and CoreOS’s Prometheus Operator and kube-prometheus projects. These projects bake in standard configurations and dashboards for Prometheus and Grafana, and abstract away some of the lower-level Kubernetes object definitions. The Helm prometheus-operator chart allows you to get a full cluster monitoring solution up and running by installing Prometheus Operator and the rest of the components listed above, along with a default set of dashboards, rules, and alerts useful for monitoring Kubernetes clusters.
In this tutorial, we will demonstrate how to install the prometheus-operator Helm chart on a Alibaba Cloud Kubernetes cluster. By the end of the tutorial, you will have installed a full monitoring stack into your cluster.
Prerequisites
To follow this tutorial, you will need:
- An Alibaba Cloud Kubernetes cluster.
- The
kubectlcommand-line interface installed on your local machine and configured to connect to your cluster. You can read more about installing and configuringkubectlin its official documentation. - The Helm package manager (2.10+) installed on your local machine and Tiller installed on your cluster.
Creating a Custom Values File
Before we install the prometheus-operator Helm chart, we’ll create a custom values file that will override some of the chart’s defaults with DigitalOcean-specific configuration parameters. To learn more about overriding default chart values, consult the Helm Install section of the Helm docs.
To begin, create and open a file called custom-values.yaml on your local machine using nano or your favorite editor:
nano custom-values.yaml
Copy and paste in the following custom values, which enable persistent storage for the Prometheus, Grafana, and Alertmananger components, and disable monitoring for Kubernetes control planel components not exposed on Alibaba Cloud Kubernetes:
custom-values.yaml
# Define persistent storage for Prometheus (PVC)
prometheus:
prometheusSpec:
storageSpec:
volumeClaimTemplate:
spec:
accessModes: ["ReadWriteOnce"]
storageClassName: do-block-storage
resources:
requests:
storage: 5Gi

# Define persistent storage for Grafana (PVC)
grafana:
# Set password for Grafana admin user
adminPassword: your_admin_password
persistence:
enabled: true
storageClassName: do-block-storage
accessModes: ["ReadWriteOnce"]
size: 5Gi

# Define persistent storage for Alertmanager (PVC)
alertmanager:
alertmanagerSpec:
storage:
volumeClaimTemplate:
spec:
accessModes: ["ReadWriteOnce"]
storageClassName: do-block-storage
resources:
requests:
storage: 5Gi

# Change default node-exporter port
prometheus-node-exporter:
service:
port: 30206
targetPort: 30206

# Disable Etcd metrics
kubeEtcd:
enabled: false

# Disable Controller metrics
kubeControllerManager:
enabled: false

# Disable Scheduler metrics
kubeScheduler:
enabled: false
In this file, we override some of the default values packaged with the chart in its values.yaml file.
We first enable persistent storage for Prometheus, Grafana, and Alertmanager so that their data persists across Pod restarts. Behind the scenes, this defines a 5 Gi Persistent Volume Claim (PVC) for each component, using the Alibaba Cloud Block Storage storage class. You should modify the size of these PVCs to suit your monitoring storage needs. To learn more about PVCs, consult Persistent Volumes from the official Kubernetes docs.
Next, replace your_admin_password with a secure password that you’ll use to log in to the Grafana metrics dashboard with the admin user.
We’ll then configure a different port for node-exporter. Node-exporter runs on each Kubernetes node and provides OS and hardware metrics to Prometheus. We must change its default port to get around the DigitalOcean Kubernetes firewall defaults, which will block port 9100 but allow ports in the range 30000-32767. Alternatively, you can configure a custom firewall rule for node-exporter.
Finally, we’ll disable metrics collection for three Kubernetes control panel components that do not expose metrics on Alibaba Cloud Kubernetes: the Kubernetes Scheduler and Controller Manager, and etcd cluster data store.
To see the full list of configurable parameters for the prometheus-operator chart, consult the Configuration section from the chart repo README or the default values file.
When you’re done editing, save and close the file. We can now install the chart using Helm.
Installing the prometheus-operator Chart
The prometheus-operator Helm chart will install the following monitoring components into your DigitalOcean Kubernetes cluster:
- Prometheus Operator, a Kubernetes Operator that allows you to configure and manage Prometheus clusters. Kubernetes Operators integrate domain-specific logic into the process of packaging, deploying, and managing applications with Kubernetes. To learn more about Kubernetes Operators, consult the CoreOS Operators Overview. To learn more about Prometheus Operator, consult this introductory post on the Prometheus Operator and the Prometheus Operator GitHub repo. Prometheus Operator will be installed as a Deployment.
- Prometheus, installed as a StatefulSet.
- Alertmanager, a service that handles alerts sent by the Prometheus server and routes them to integrations like PagerDuty or email. To learn more about Alertmanager, consult Alerting from the Prometheus docs. Alertmanager will be installed as a StatefulSet.
- Grafana, a time series data visualization tool that allows you to visualize and create dashboards for your Prometheus metrics. Grafana will be installed as a Deployment.
- node-exporter, a Prometheus exporter that runs on cluster nodes and provides OS and hardware metrics to Prometheus. Consult the node-exporter GitHub repo to learn more. node-exporter will be installed as a DaemonSet.
- kube-state-metrics, an add-on agent that listens to the Kubernetes API server and generates metrics about the state of Kubernetes objects like Deployments and Pods. You can learn more by consulting the kube-state-metrics GitHub repo. kube-state-metrics will be installed as a Deployment.
By default, along with scraping metrics generated by node-exporter, kube-state-metrics, and the other components listed above, Prometheus will be configured to scrape metrics from the following components:
- kube-apiserver, the Kubernetes API server.
- CoreDNS, the Kubernetes cluster DNS server.
- kubelet, the primary node agent that interacts with kube-apiserver to manage Pods and containers on a node.
- cAdvisor, a node agent that discovers running containers and collects their CPU, memory, filesystem, and network usage metrics.
On your local machine, let’s begin by installing the prometheus-operator Helm chart and passing in the custom values file we created above:
helm install --namespace monitoring --name doks-cluster-monitoring -f custom-values.yaml stable/prometheus-operator
Here we run helm install and install all components into the monitoring namespace, which we create at the same time. This allows us to cleanly separate the monitoring stack from the rest of the Kubernetes cluster. We name the Helm release doks-cluster-monitoring and pass in the custom values file we created in Step 1. Finally, we specify that we’d like to install the prometheus-operator chart from the Helm stable directory.
You should see the following output:
NAME: doks-cluster-monitoring
LAST DEPLOYED: Sun Oct 27 10:30:42 2019
NAMESPACE: monitoring
STATUS: DEPLOYED

RESOURCES:
==> v1/PersistentVolumeClaim
NAME STATUS VOLUME CAPACITY ACCESS MODES STORAGECLASS AGE
doks-cluster-monitoring-grafana Pending do-block-storage 10s

==> v1/ServiceAccount
NAME SECRETS AGE
doks-cluster-monitoring-grafana 1 10s
doks-cluster-monitoring-kube-state-metrics 1 10s

. . .

==> v1beta1/ClusterRoleBinding
NAME AGE
doks-cluster-monitoring-kube-state-metrics 9s
psp-doks-cluster-monitoring-prometheus-node-exporter 9s

NOTES:
The Prometheus Operator has been installed. Check its status by running:
kubectl --namespace monitoring get pods -l "release=doks-cluster-monitoring"

Visit https://github.com/coreos/prometheus-operator for instructions on how
to create & configure Alertmanager and Prometheus instances using the Operator.
This indicates that Prometheus Operator, Prometheus, Grafana, and the other components listed above have successfully been installed into your DigitalOcean Kubernetes cluster.
Following the note in the helm install output, check the status of the release’s Pods using kubectl get pods:
kubectl --namespace monitoring get pods -l "release=doks-cluster-monitoring"
You should see the following:
Output
NAME                                                       READY STATUS     RESTARTS   AGE
doks-cluster-monitoring-grafana-9d7f984c5-hxnw6            2/2   Running    0          3m36s
doks-cluster-monitoring-kube-state-metrics-dd8557f6b-9rl7j 1/1   Running    0          3m36s
doks-cluster-monitoring-pr-operator-9c5b76d78-9kj85        1/1   Running    0          3m36s
doks-cluster-monitoring-prometheus-node-exporter-2qvxw     1/1   Running    0          3m36s
doks-cluster-monitoring-prometheus-node-exporter-7brwv     1/1   Running    0          3m36s
doks-cluster-monitoring-prometheus-node-exporter-jhdgz     1/1   Running    0          3m36s
This indicates that all the monitoring components are up and running, and you can begin exploring Prometheus metrics using Grafana and its preconfigured dashboards.
Accessing Grafana and Exploring Metrics Data
The prometheus-operator Helm chart exposes Grafana as a ClusterIP Service, which means that it’s only accessible via a cluster-internal IP address. To access Grafana outside of your Kubernetes cluster, you can either use kubectl patch to update the Service in place to a public-facing type like NodePort or LoadBalancer, or kubectl port-forward to forward a local port to a Grafana Pod port.
In this tutorial we’ll forward ports, but to learn more about kubectl patch and Kubernetes Service types, you can consult Update API Objects in Place Using kubectl patch and Services from the official Kubernetes docs.
Begin by listing running Services in the monitoring namespace:
kubectl get svc -n monitoring
You should see the following Services:
NAME                                               TYPE        CLUSTER-IP       EXTERNAL-IP   PORT(S)             AGE
alertmanager-operated                              ClusterIP   None             <none>        9093/TCP,6783/TCP   34m
doks-cluster-monitoring-grafana                    ClusterIP   10.245.105.130   <none>        80/TCP              34m
doks-cluster-monitoring-kube-state-metrics         ClusterIP   10.245.140.151   <none>        8080/TCP            34m
doks-cluster-monitoring-pr-alertmanager            ClusterIP   10.245.197.254   <none>        9093/TCP            34m
doks-cluster-monitoring-pr-operator                ClusterIP   10.245.14.163    <none>        8080/TCP            34m
doks-cluster-monitoring-pr-prometheus              ClusterIP   10.245.201.173   <none>        9090/TCP            34m
doks-cluster-monitoring-prometheus-node-exporter   ClusterIP   10.245.72.218    <none>        30206/TCP           34m
prometheus-operated                                ClusterIP   None             <none>        9090/TCP            34m
We are going to forward local port 8000 to port 80 of the doks-cluster-monitoring-grafana Service, which will in turn forward to port 3000 of a running Grafana Pod. These Service and Pod ports are configured in the stable/grafana Helm chart values file:
kubectl port-forward -n monitoring svc/doks-cluster-monitoring-grafana 8000:80
You should see the following output:
Forwarding from 127.0.0.1:8000 -> 3000
Forwarding from [::1]:8000 -> 3000
This indicates that local port 8000 is being forwarded successfully to a Grafana Pod.
Visit http://localhost:8000 in your web browser. You should see the following Grafana login page:
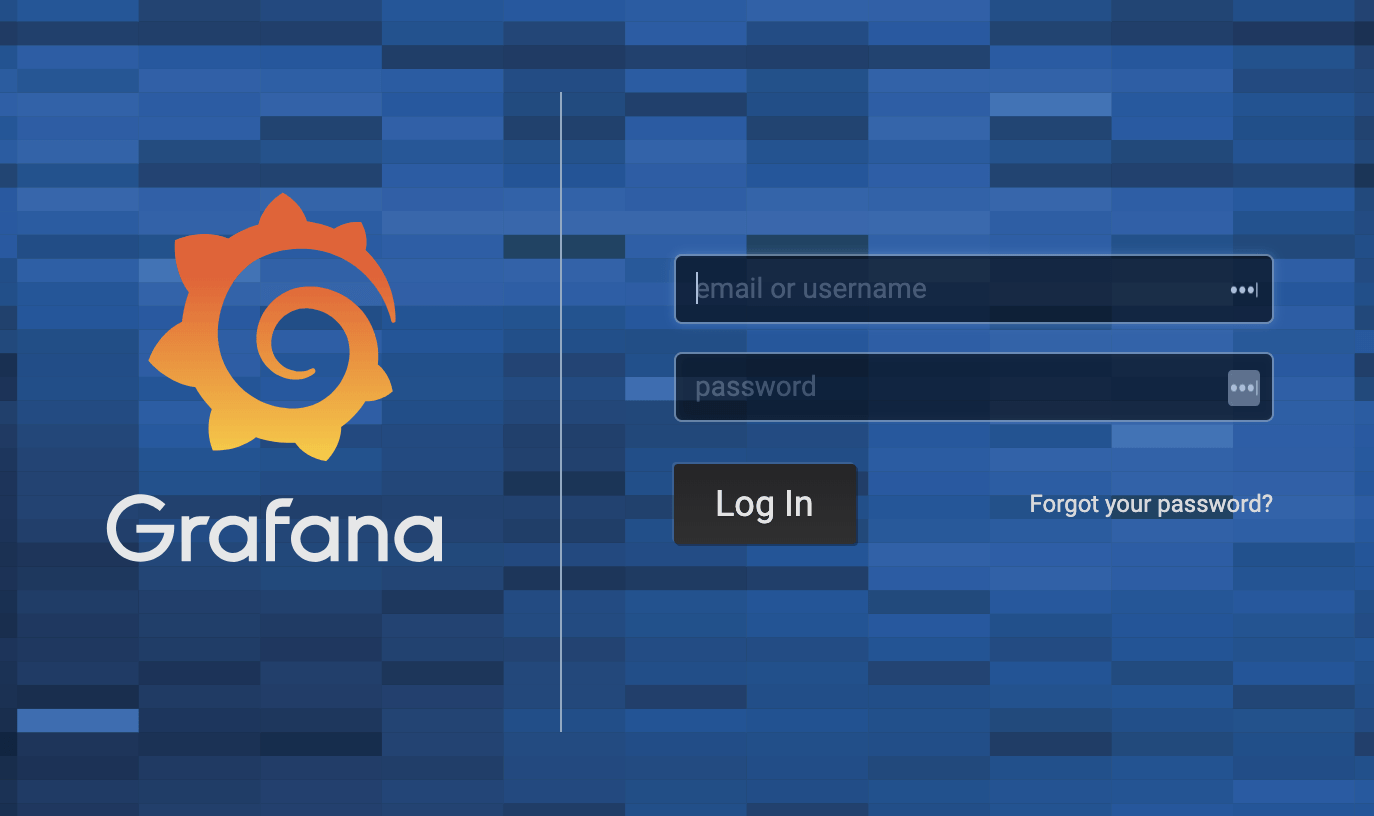
Enter admin as the username and the password you configured in custom-values.yaml. Then, hit Log In.
You’ll be brought to the following Home Dashboard:
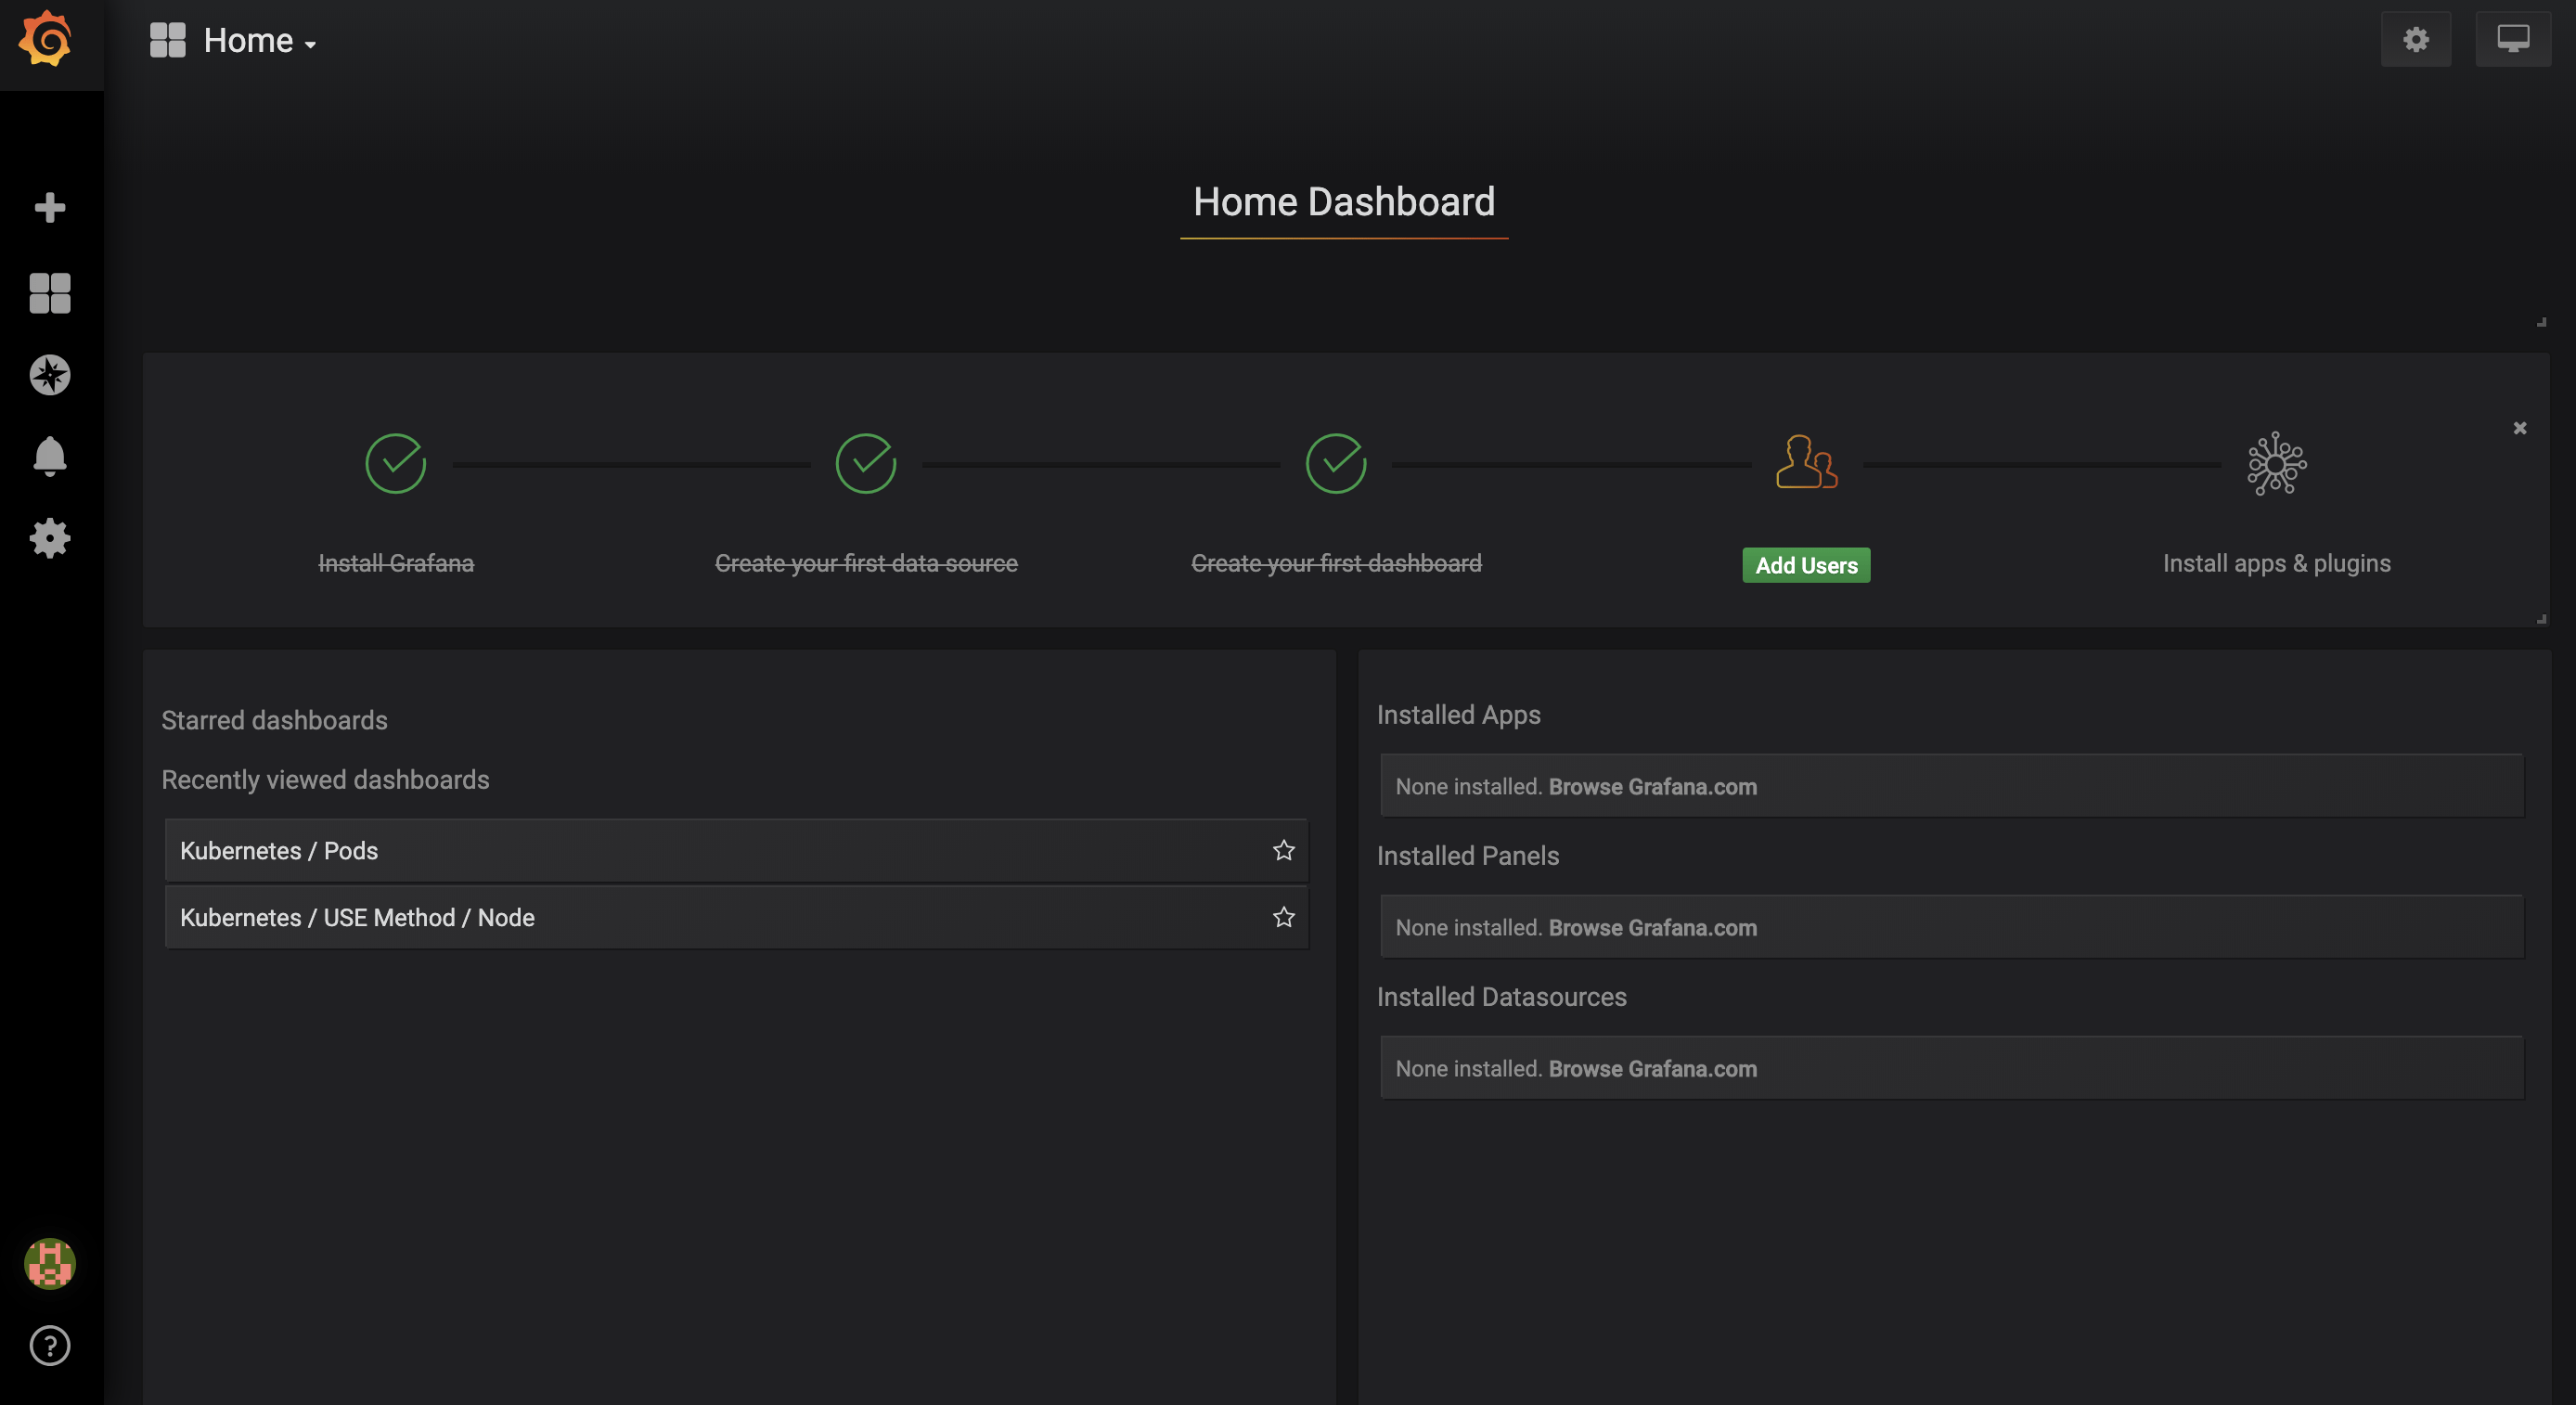
In the left-hand navigation bar, select the Dashboards button, then click on Manage:
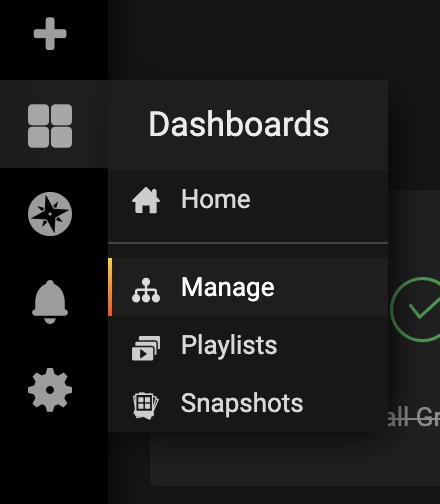
You’ll be brought to the following dashboard management interface, which lists the dashboards installed by the prometheus-operator Helm chart:
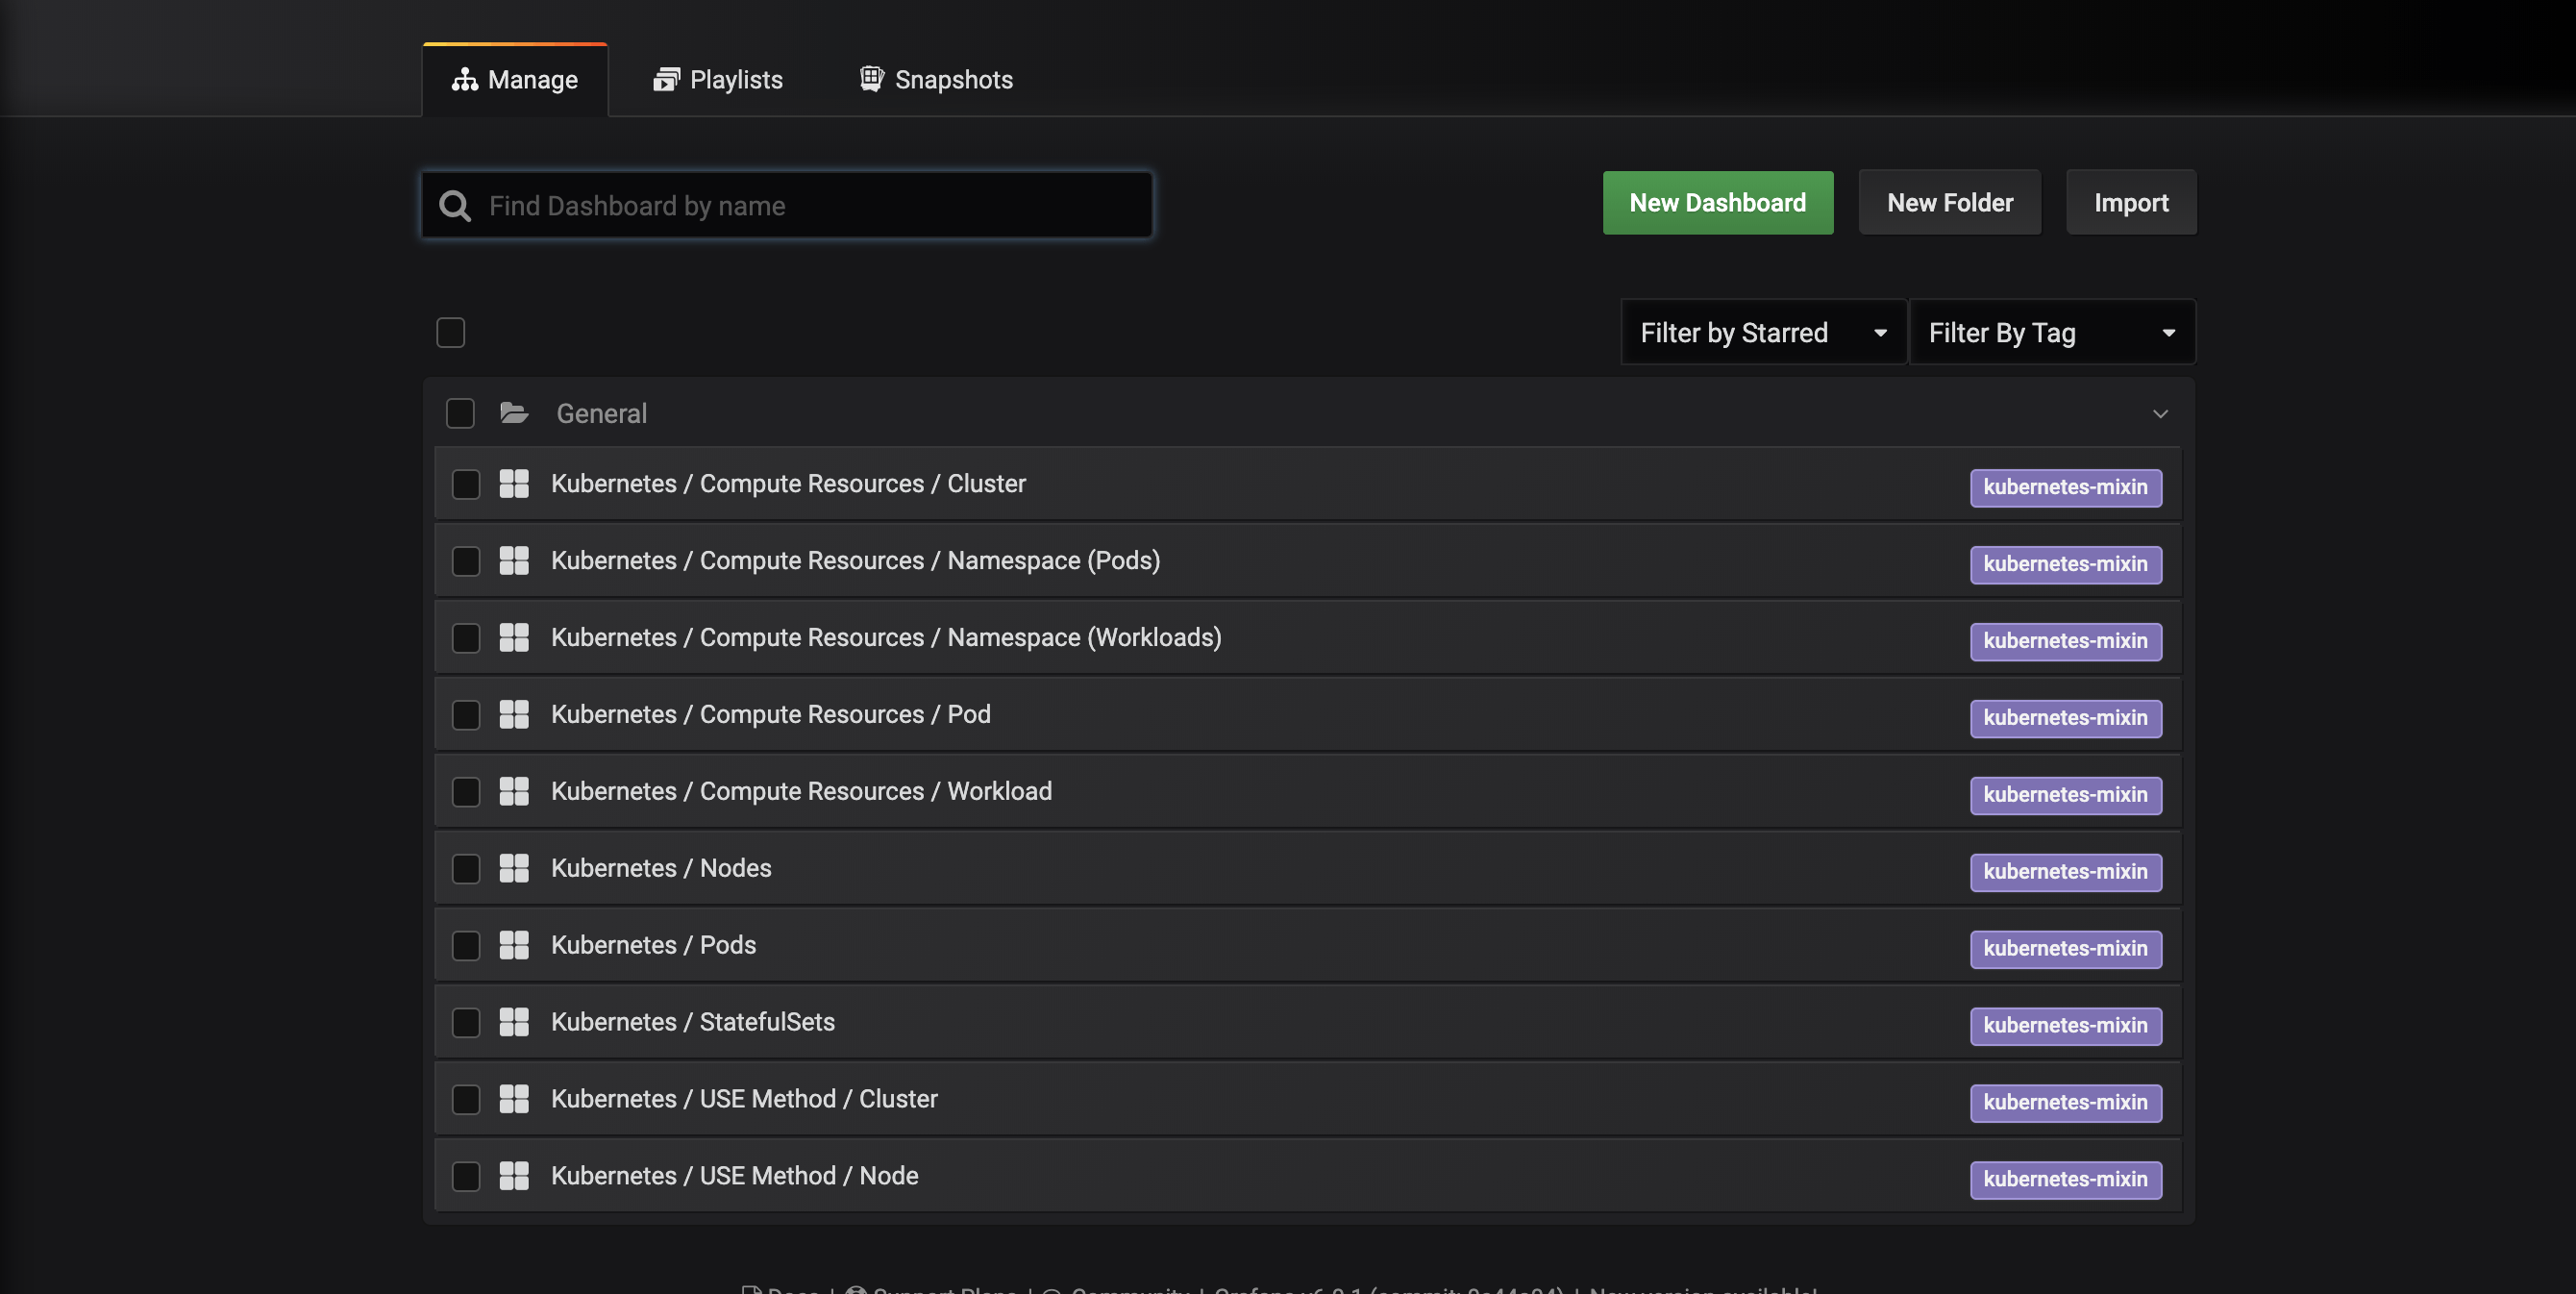
These dashboards are generated by kubernetes-mixin, an open-source project that allows you to create a standardized set of cluster monitoring Grafana dashboards and Prometheus alerts. To learn more, consult the Kubernetes Mixin GitHub repo.
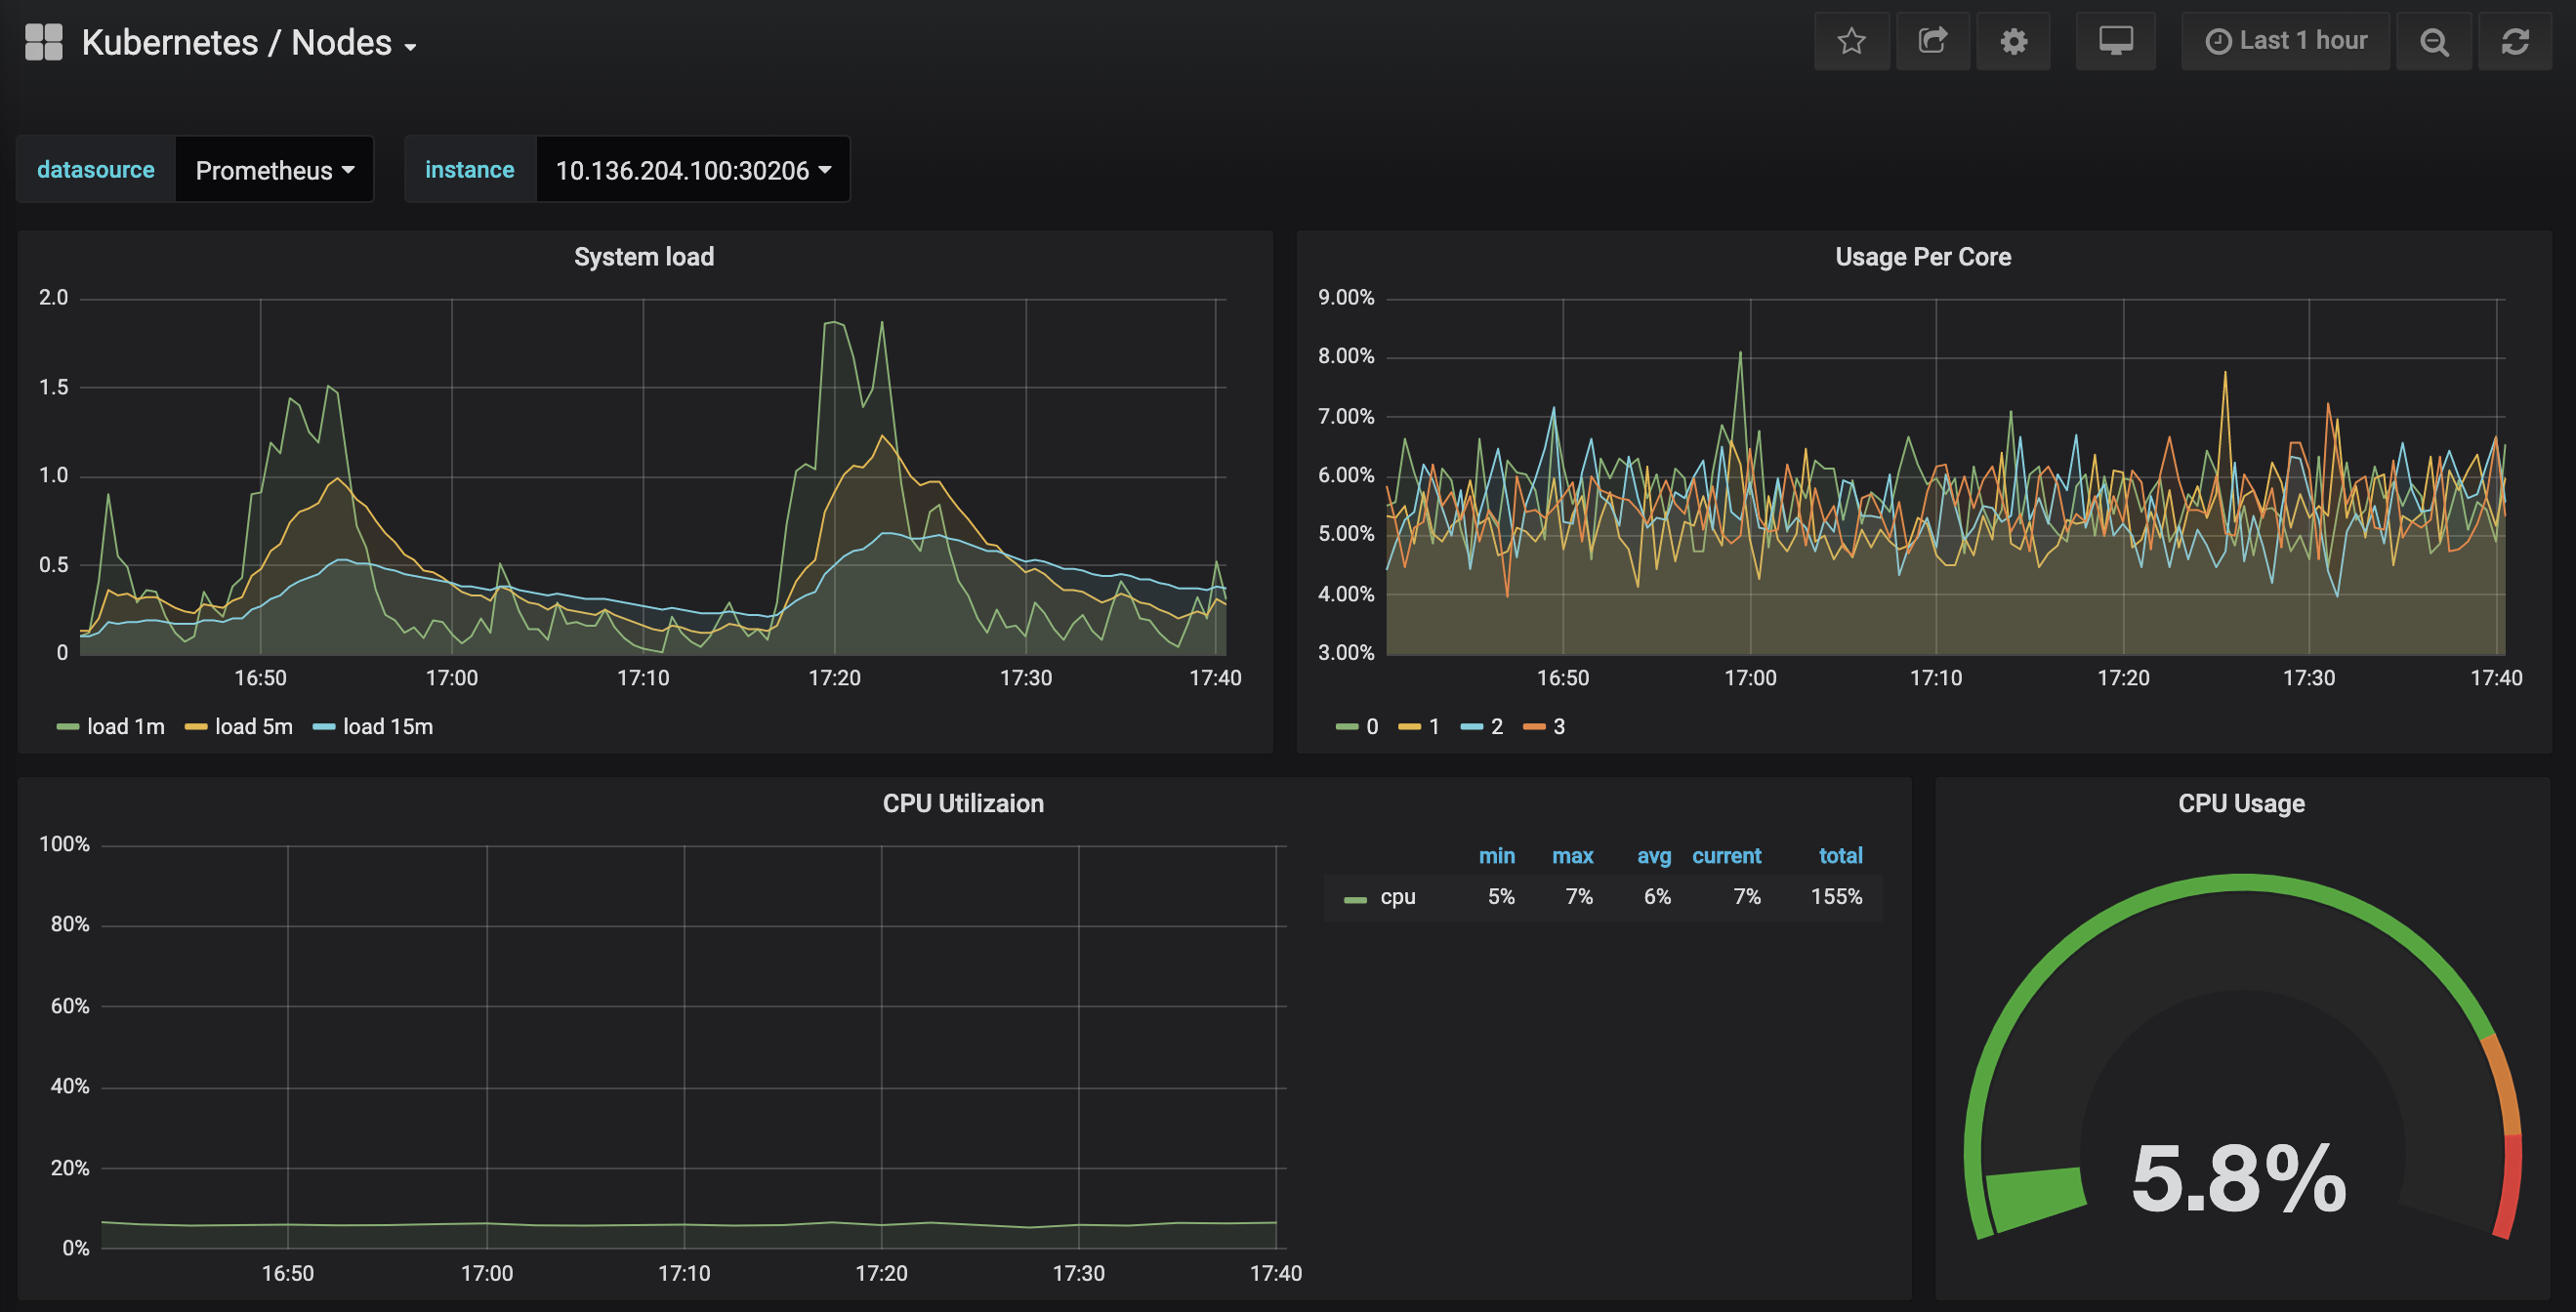
Click in to the Kubernetes / Nodes dashboard, which visualizes CPU, memory, disk, and network usage for a given node:
Describing each dashboard and how to use it to visualize your cluster’s metrics data goes beyond the scope of this tutorial. To learn more about the USE method for analyzing a system’s performance, you can consult Brendan Gregg’s The Utilization Saturation and Errors (USE) Method page. Google’s SRE Book is another helpful resource, in particular Chapter 6: Monitoring Distributed Systems. To learn how to build your own Grafana dashboards, check out Grafana’s Getting Started page.
In the next step, we’ll follow a similar process to connect to and explore the Prometheus monitoring system.
Accessing Prometheus and Alertmanager
To connect to the Prometheus Pods, we once again have to use kubectl port-forward to forward a local port. If you’re done exploring Grafana, you can close the port-forward tunnel by hitting CTRL-C. Alternatively you can open a new shell and port-forward connection.
Begin by listing running Services in the monitoring namespace:
kubectl get svc -n monitoring
You should see the following Services:
NAME                                               TYPE        CLUSTER-IP       EXTERNAL-IP   PORT(S)             AGE
alertmanager-operated                              ClusterIP   None             <none>        9093/TCP,6783/TCP   34m
doks-cluster-monitoring-grafana                    ClusterIP   10.245.105.130   <none>        80/TCP              34m
doks-cluster-monitoring-kube-state-metrics         ClusterIP   10.245.140.151   <none>        8080/TCP            34m
doks-cluster-monitoring-pr-alertmanager            ClusterIP   10.245.197.254   <none>        9093/TCP            34m
doks-cluster-monitoring-pr-operator                ClusterIP   10.245.14.163    <none>        8080/TCP            34m
doks-cluster-monitoring-pr-prometheus              ClusterIP   10.245.201.173   <none>        9090/TCP            34m
doks-cluster-monitoring-prometheus-node-exporter   ClusterIP   10.245.72.218    <none>        30206/TCP           34m
prometheus-operated                                ClusterIP   None             <none>        9090/TCP            34m
We are going to forward local port 9090 to port 9090 of the doks-cluster-monitoring-pr-prometheus Service:
kubectl port-forward -n monitoring svc/doks-cluster-monitoring-pr-prometheus 9090:9090
You should see the following output:
Forwarding from 127.0.0.1:9090 -> 9090
Forwarding from [::1]:9090 -> 9090
This indicates that local port 9090 is being forwarded successfully to a Prometheus Pod.
Visit http://localhost:9090 in your web browser. You should see the following Prometheus Graph page:
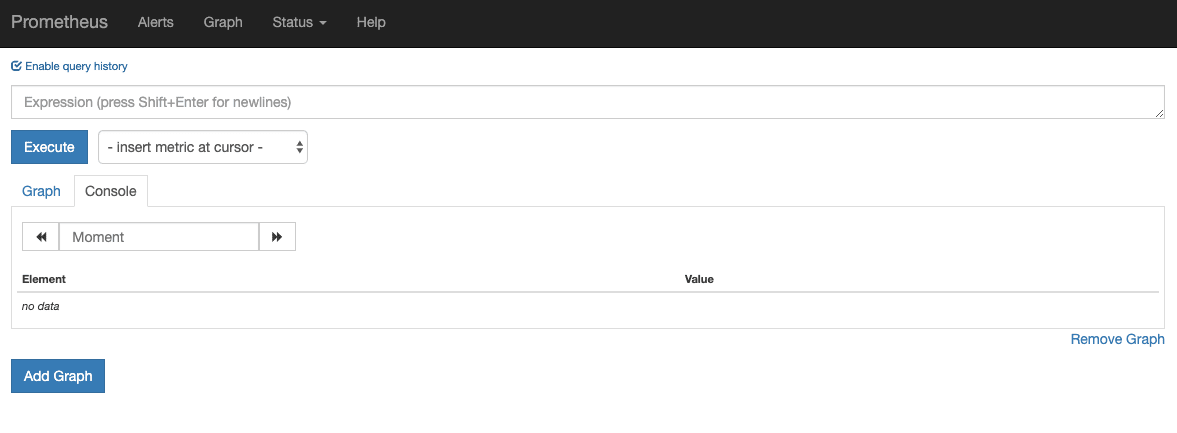
From here you can use PromQL, the Prometheus query language, to select and aggregate time series metrics stored in its database. To learn more about PromQL, consult Querying Prometheus from the official Prometheus docs.
In the Expression field, type machine_cpu_cores and hit Execute. You should see a list of time series with the metric machine_cpu_cores that reports the number of CPU cores on a given node. You can see which node generated the metric and which job scraped the metric in the metric labels.
Finally, in the top navigation bar, click on Status and then Targets to see the list of targets Prometheus has been configured to scrape. You should see a list of targets corresponding to the list of monitoring endpoints described at the beginning of Step 2.
To learn more about Promtheus and how to query your cluster metrics, consult the official Prometheus docs.
We’ll follow a similar process to connect to AlertManager, which manages Alerts generated by Prometheus. You can explore these Alerts by clicking into Alerts in the Prometheus top navigation bar.
To connect to the Alertmanager Pods, we will once again use kubectl port-forward to forward a local port. If you’re done exploring Prometheus, you can close the port-forward tunnel by hitting CTRL-C. Alternatively you can open a new shell and port-forward connection.
Begin by listing running Services in the monitoring namespace:
kubectl get svc -n monitoring
You should see the following Services:
NAME                                               TYPE        CLUSTER-IP       EXTERNAL-IP   PORT(S)             AGE
alertmanager-operated                              ClusterIP   None             <none>        9093/TCP,6783/TCP   34m
doks-cluster-monitoring-grafana                    ClusterIP   10.245.105.130   <none>        80/TCP              34m
doks-cluster-monitoring-kube-state-metrics         ClusterIP   10.245.140.151   <none>        8080/TCP            34m
doks-cluster-monitoring-pr-alertmanager            ClusterIP   10.245.197.254   <none>        9093/TCP            34m
doks-cluster-monitoring-pr-operator                ClusterIP   10.245.14.163    <none>        8080/TCP            34m
doks-cluster-monitoring-pr-prometheus              ClusterIP   10.245.201.173   <none>        9090/TCP            34m
doks-cluster-monitoring-prometheus-node-exporter   ClusterIP   10.245.72.218    <none>        30206/TCP           34m
prometheus-operated                                ClusterIP   None             <none>        9090/TCP            34m
We are going to forward local port 9093 to port 9093 of the doks-cluster-monitoring-pr-alertmanager Service.
kubectl port-forward -n monitoring svc/doks-cluster-monitoring-pr-alertmanager 9093:9093
You should see the following output:
Forwarding from 127.0.0.1:9093 -> 9093
Forwarding from [::1]:9093 -> 9093
This indicates that local port 9093 is being forwarded successfully to an Alertmanager Pod.
Visit http://localhost:9093 in your web browser. You should see the following Alertmanager Alerts page:
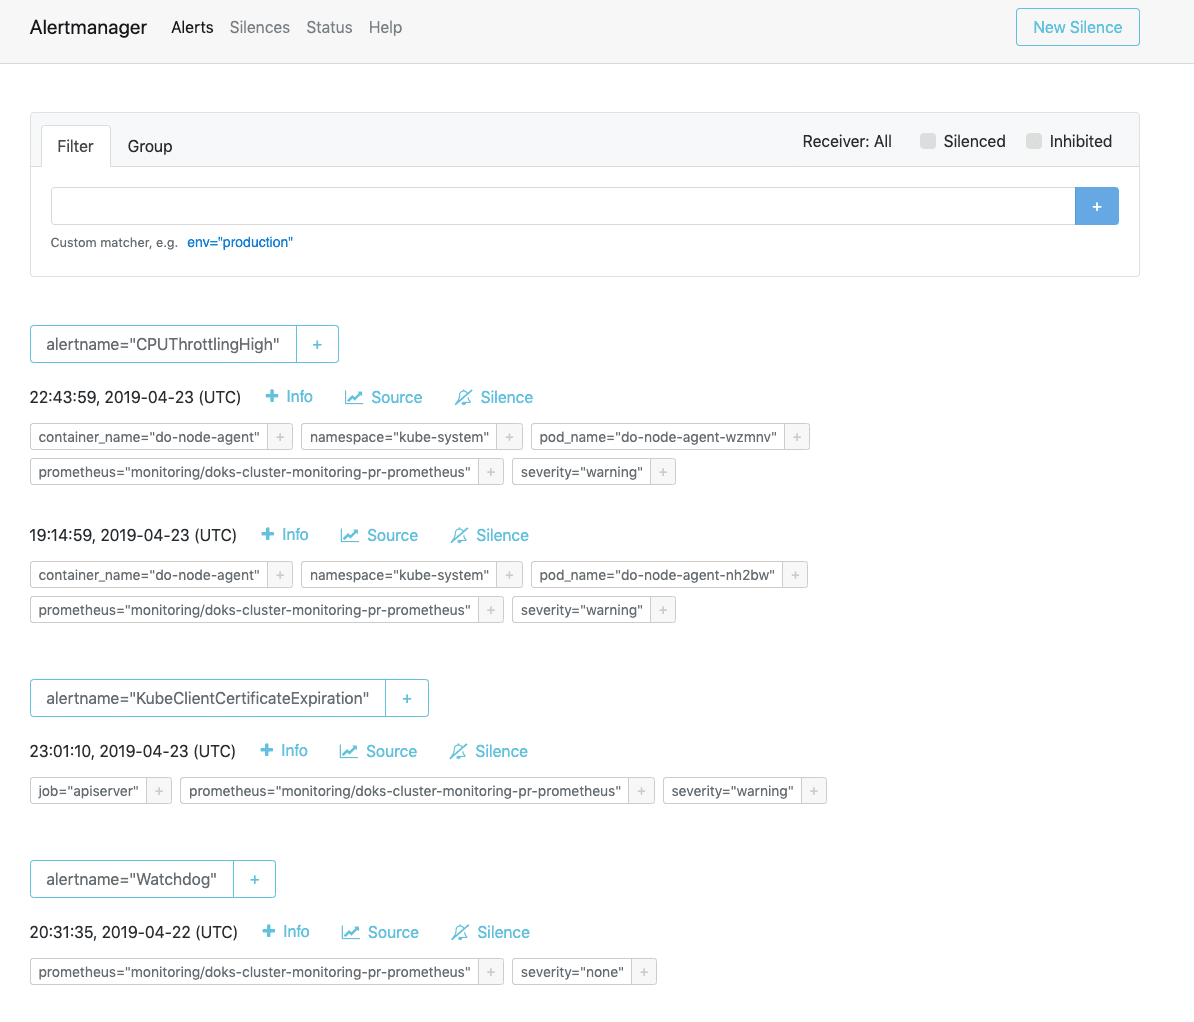
From here, you can explore firing alerts and optionally silencing them. To learn more about Alertmanager, consult the official Alertmanager documentation.
Conclusion
In this tutorial, you installed a Prometheus, Grafana, and Alertmanager monitoring stack into your Alibaba Cloud Kubernetes cluster with a standard set of dashboards, Prometheus rules, and alerts. Since this was done using Helm, you can use helm upgrade, helm rollback, and helm delete to upgrade, roll back, or delete the monitoring stack.
The prometheus-operator chart helps you get cluster monitoring up and running quickly using Helm. You may wish to build, deploy, and configure Prometheus Operator manually. To do so, consult the Prometheus Operator and kube-prometheus GitHub repos.